On Risk Management
Every project is prone to risks. To ensure success we must anticipate them, and implement contingency plans in order to prevent, mitigate, or circumvent them. In this post I demonstrate the risk management tree as a structured thinking tool for identifying risks and countermeasures in a project. I also touch on the classical Process Decision Program Chart, how it’s changed, and what we can learn from its original form in risk management.

By failing to prepare you are preparing to fail.
🧭 Navigation
- Risks in Projects
- The Process Decision Program Chart
- The Risk Management Tree
- Examples in Practice
- Key Takeaways
Risks in Projects
Every project is subject to risk. These are events that may delay, obstruct, or prevent its completion. They are inherently uncertain because, if we knew with 100% confidence that a problem would occur, we could plan around it. And this uncertainty arises from our limited knowledge of a complicated world.
There are 4 types of knowledge that we encounter in a project:
- Known knowns,
- Unknown knowns,
- Known unknowns, and
- Unknown unknowns.
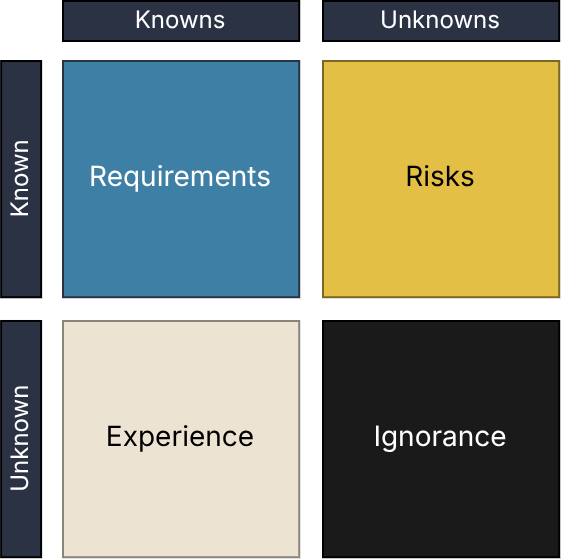
Known knowns are explicit knowledge; things we are aware of. These are the project requirements, and we undertake tasks in the project in order to fulfil them.
Unknown knowns are tacit knowledge; things we know but cannot consciously recall. These are implicitly understood and not verbalised as part of the project. Everything that is delegated to a subject matter expert falls under this category.
Unknown unknowns are things we are ignorant of. They cannot be addressed.
Known unknowns are the uncertainties we are aware of. This is where risks occur. Will the deliveries arrive on time to complete the project? Will it rain and delay construction? Will the prototype work as intended? Making these risks salient, and planning contingencies to handle them, are crucial to successful project completion.
The Process Decision Program Chart
This tool is one of the 7 Management & Planning Tools proposed in “Management for Quality Improvement: The 7 New QC Tools” 1 and was the most direct for managing risks:
- Activity Network Diagram
- Affinity Diagram
- Interrelationship Digraph
- Matrix Diagram
- Prioritisation Matrix
- Process Decision Program Chart (PDPC)
- Tree Diagram
The original tool as it appeared in the 1988 English translation of the book is quite different from its modern conception. In the original book the PDPC was more akin to a flow chart. Its name is quite explicit:
- Process: A sequence of events to fulfil an objective.
- Decision: Choosing between alternatives.
- Program: A plan, or project.
- Chart: An illustration for the purpose of communication.
So this tool is an illustration of a planned sequence of events, and decision points, to handle risks and contingencies when things go awry. Just like Google Maps will present you with different paths to reach your destination, the PDPC shows the different routes to completing an objective.
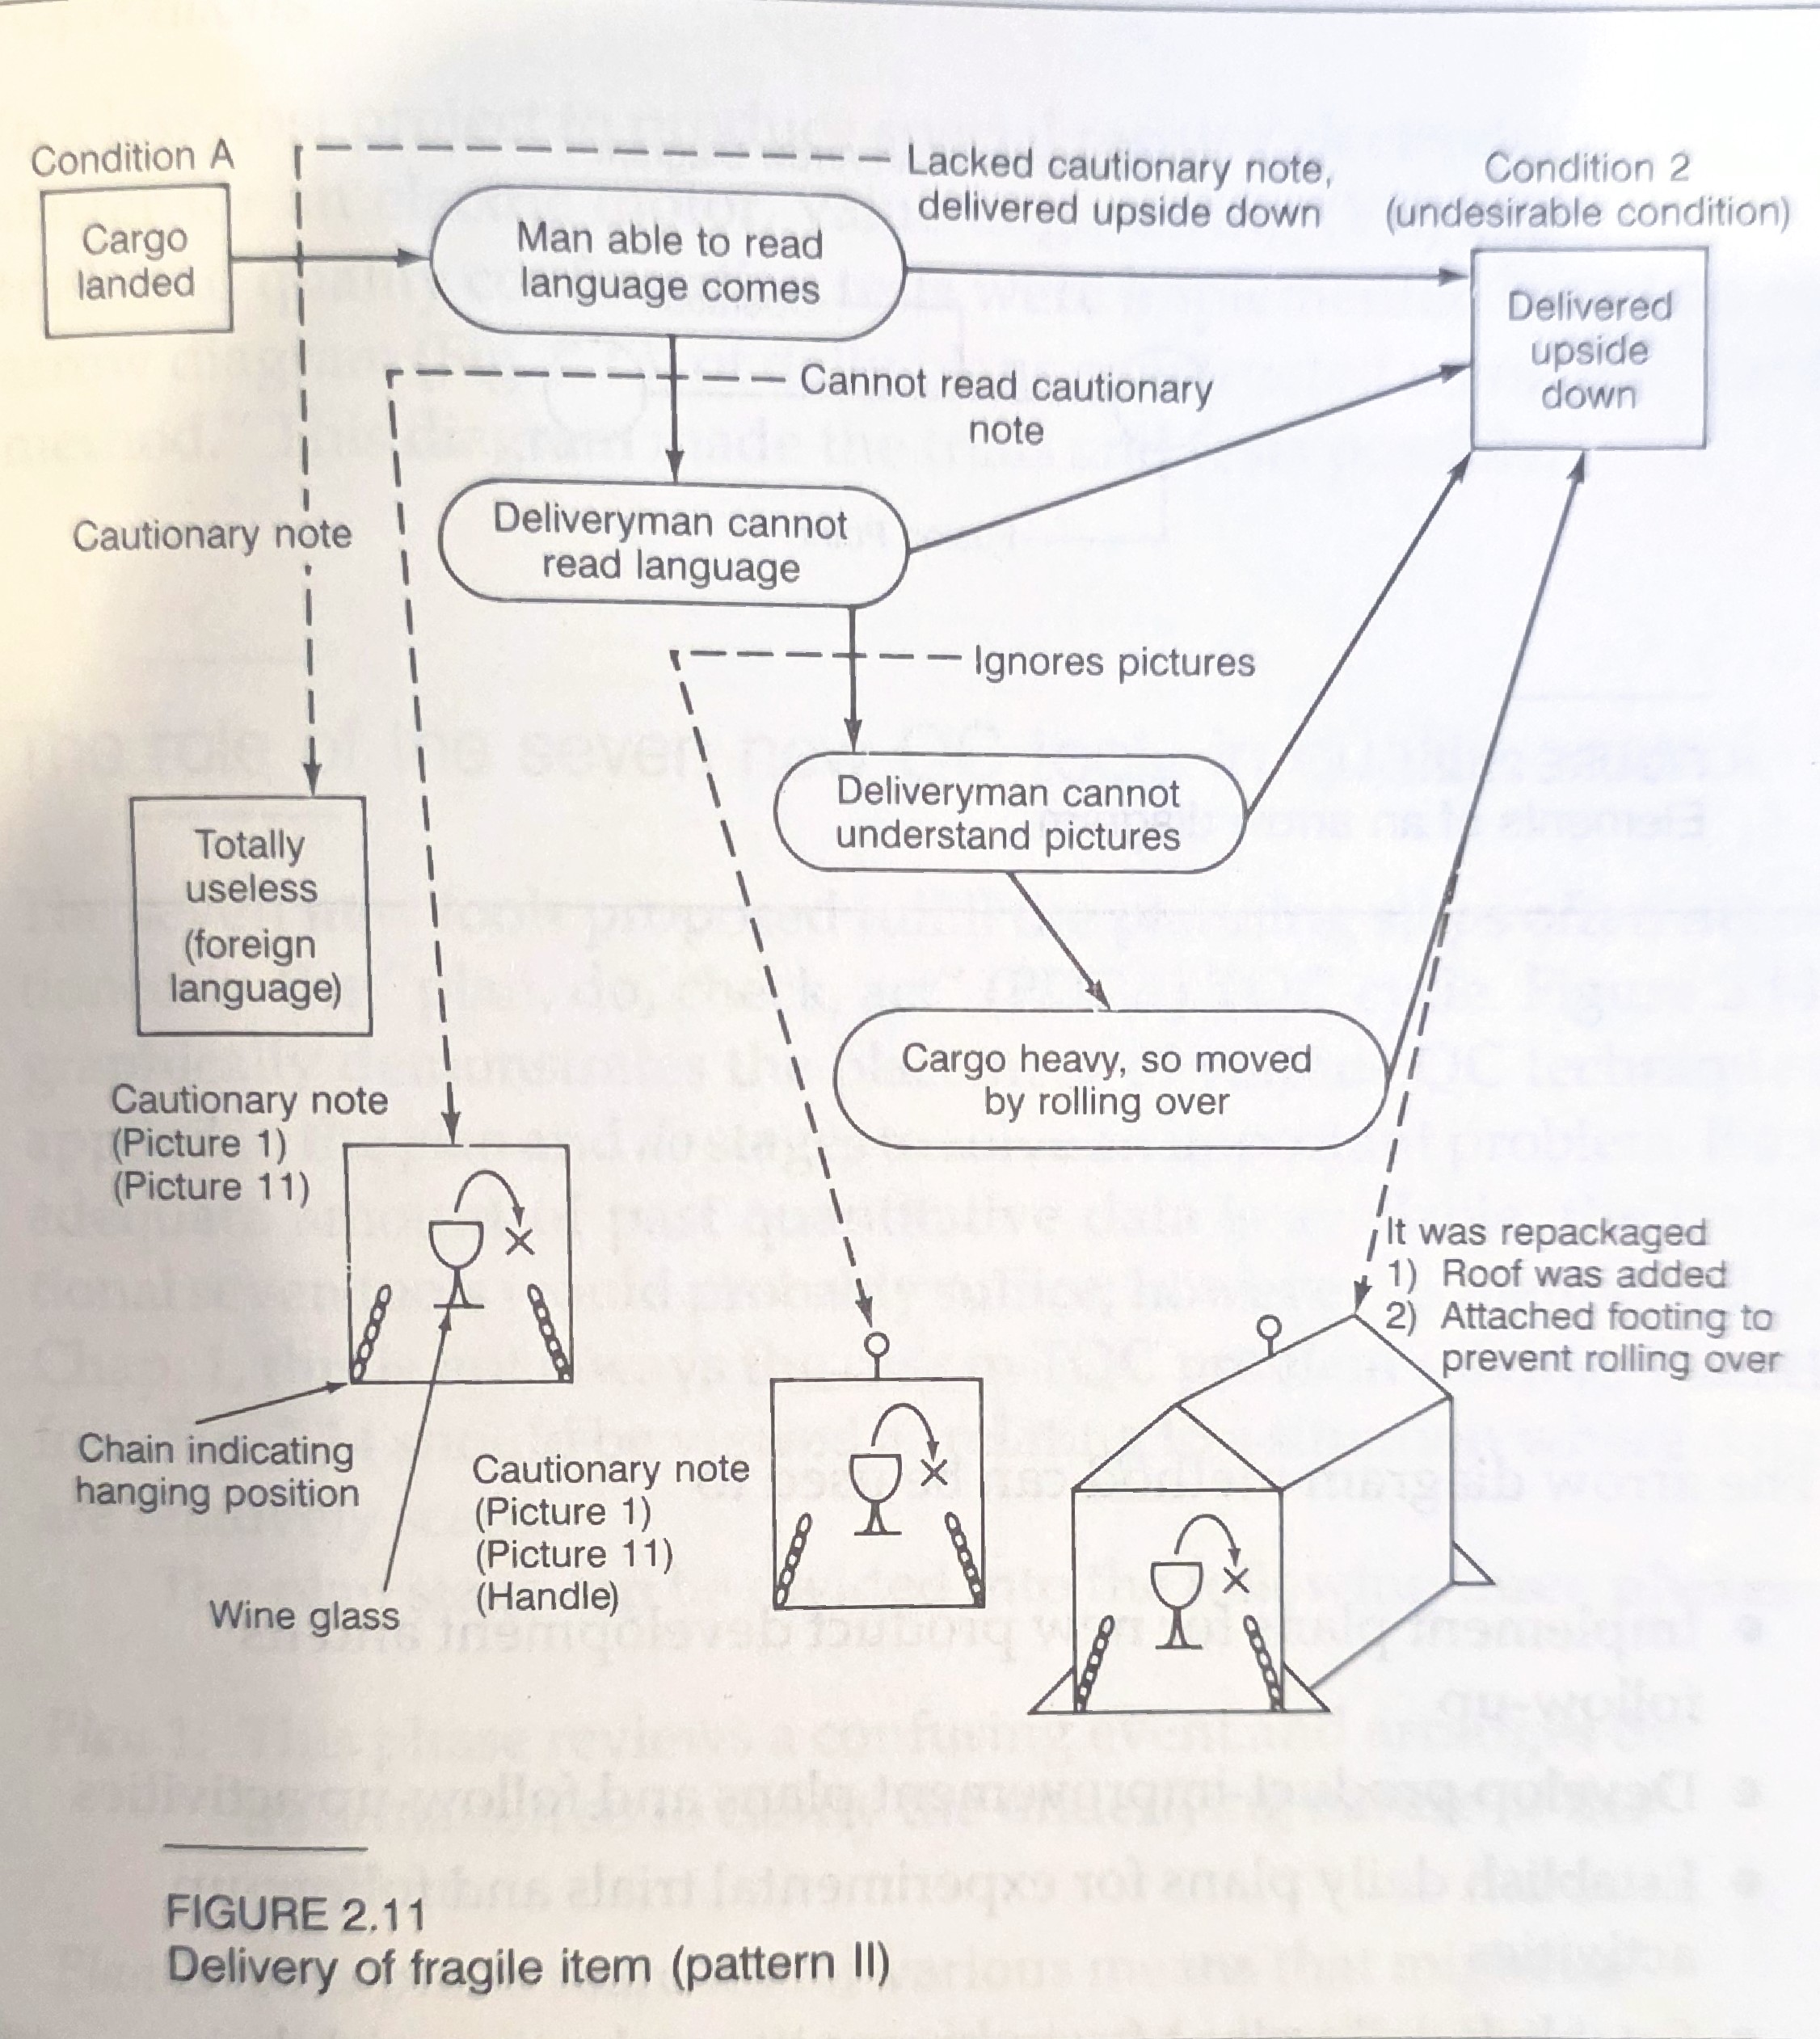
The original PDPC was more like a flow chart.
If we look at the modern conception of the chart, it’s just a tree diagram with 5 tiers.
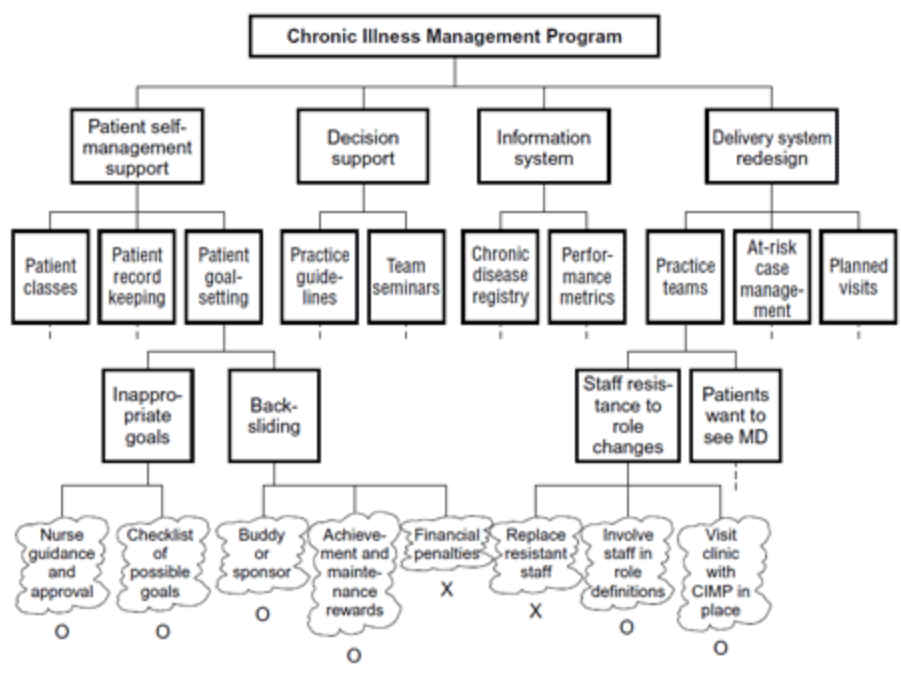
The modern PDPC is just a tree diagram (source).
The name for the modern usage of the PDPC has lost all meaning. But there are elements of both that I really like.
The original PDPC was more like an Activity Network Diagram (AND), or Program Evaluation and Review Technique (PERT), but with alternate paths showing what to do when things go wrong.
The tree diagram is useful because it naturally extends the Work Breakdown Structure (WBS): divide a large project into singular, manageable activities. Then identify, specifically, what risks each may encounter, and how you might prevent them.
The Risk Management Tree
Let’s be clear: the modern PDPC is not a PDPC. It’s a tree diagram 2. And here I’ll demonstrate how to use it effectively. The utility of this project management tool is that it allows the project team to enumerate all the project tasks, and brainstorm risks and countermeasures. By identifying known unknowns, and devising strategies to address them, it can instil the team with confidence.
Structure of the Tool
As noted before, there are five tiers to this conception of the tree diagram:
- The objective,
- The major tasks (milestones),
- The minor tasks,
- Potential risks, and
- Countermeasures.
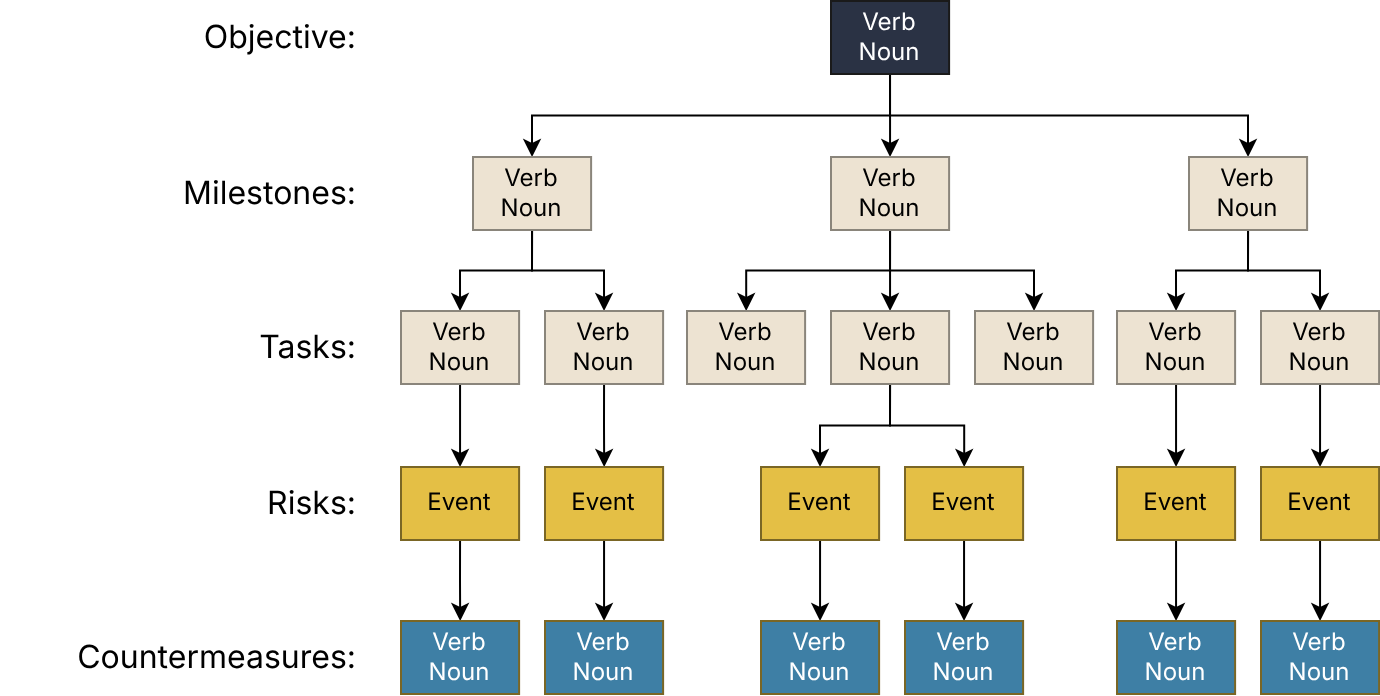
A risk management tree diagram has 5 tiers.
Four tiers are insufficient; I think it’s imperative to break down major tasks into more granular, independent activities. More than five tiers is too much; we want to preserve time, and space in the diagram, for enumerating all the risks and countermeasures.
How to Use It
Here’s how I apply this tool, step by step:
- Get the project team together in a room.
- Provide chocolate and other snacks. It’s a good way to bribe people into participation.
- Use a whiteboard and Post-It notes to create the diagram as a team.
- State the objective clearly. It should begin with a verb; this is a call to action.
- List the major activities or milestones. Again, it should be of the format verb noun. In a project we act on something.
- List all the sub-tasks needed to complete the major tasks. Again, verb noun.
- Brainstorm all the possible things that could go wrong.
- Write down countermeasures to prevent them. These can be both preventative and reactive. Same format: verb noun.
When brainstorming risks it is important to list as many ideas as possible, no matter how unlikely or silly. The important part of step 7 is to have a free flow of ideas. You will have the opportunity to prioritise and rationalise them later. It’s better to have 15 unrealistic potential risks out of 20 ideas than only 1 good idea at all.
Promote or Pivot?
Now we come to the step of filtering all the ideas for countermeasures. For each of the countermeasures we should ask the team: “promote, or pivot?”. If you’ve done a bit of risk management in project planning you’ve probably heard similar terms about delegating a risk to someone who will take responsibility, or accepting the risk and praying it won’t happen. Here is my own take on how to approach this.
⏫ Promoting Countermeasures
When we promote a countermeasure it becomes a standard sub-task in the project. By integrating it into the standard WBS we ensure that preventative measures are taken to stop the risk from occurring. Unlike the concept of “delegating”, by including it in the project plan it is tracked and monitored to ensure success.
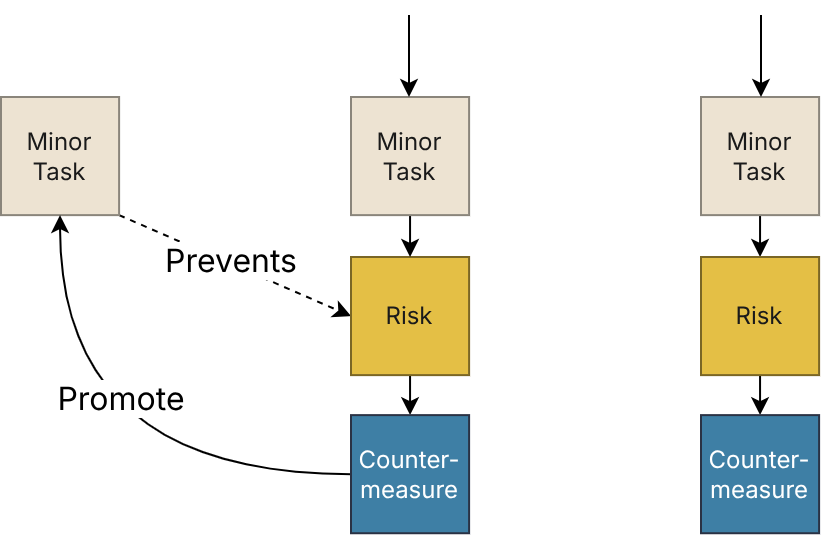
A countermeasure may be promoted to a standard task to prevent risk.
🔄 Pivoting on a Risk
This idea was inspired by the original PDPC. When things go wrong, we often have to change plans. A pivot represents a branch in our task sequencing. Rather than viewing the task sequence as one fixed path, we allow for alternative routes. This is a concept we’re familiar with in the common flow chart: we come to a decision point and follow a different path on the diagram.
It plays on the idea that we take a square Post-It note and rotate it sideways to become a diamond: the canonical symbol for a decision node in the flow chart.
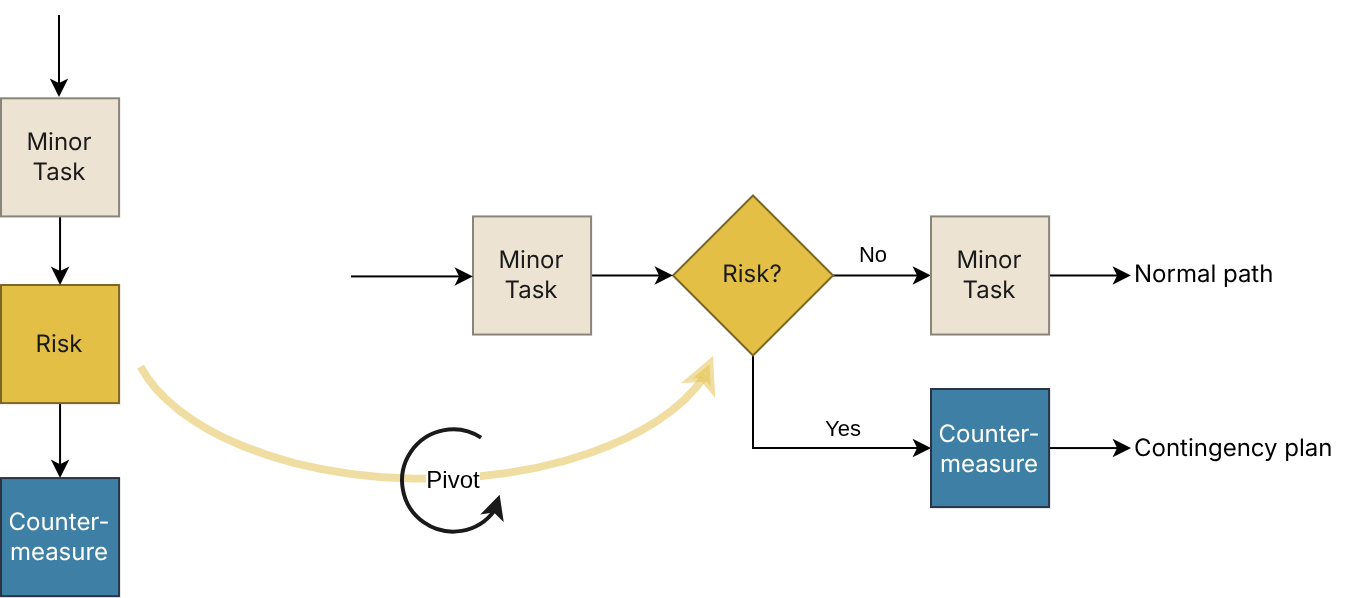
The occurrence of risks becomes a pivot point in the project plan to execute contingent strategies.
Examples in Practice
If you’ve read my blog posts, you’ll know I always practise what I preach. So here are some examples of how I’ve applied the risk management tree to real-world projects.
Human-Robot Interaction Demo
This example is from a project planning workshop I did when working on the ergoCub project while in Italy. We had about 3 months to prepare a live human-robot interaction demo for the world’s largest robotics conference in London, 2023.
In the photo you can see:
- The objective, the main tasks, and the sub-tasks using yellow Post-It notes,
- 22 risks using red, and
- 26 countermeasures using green.
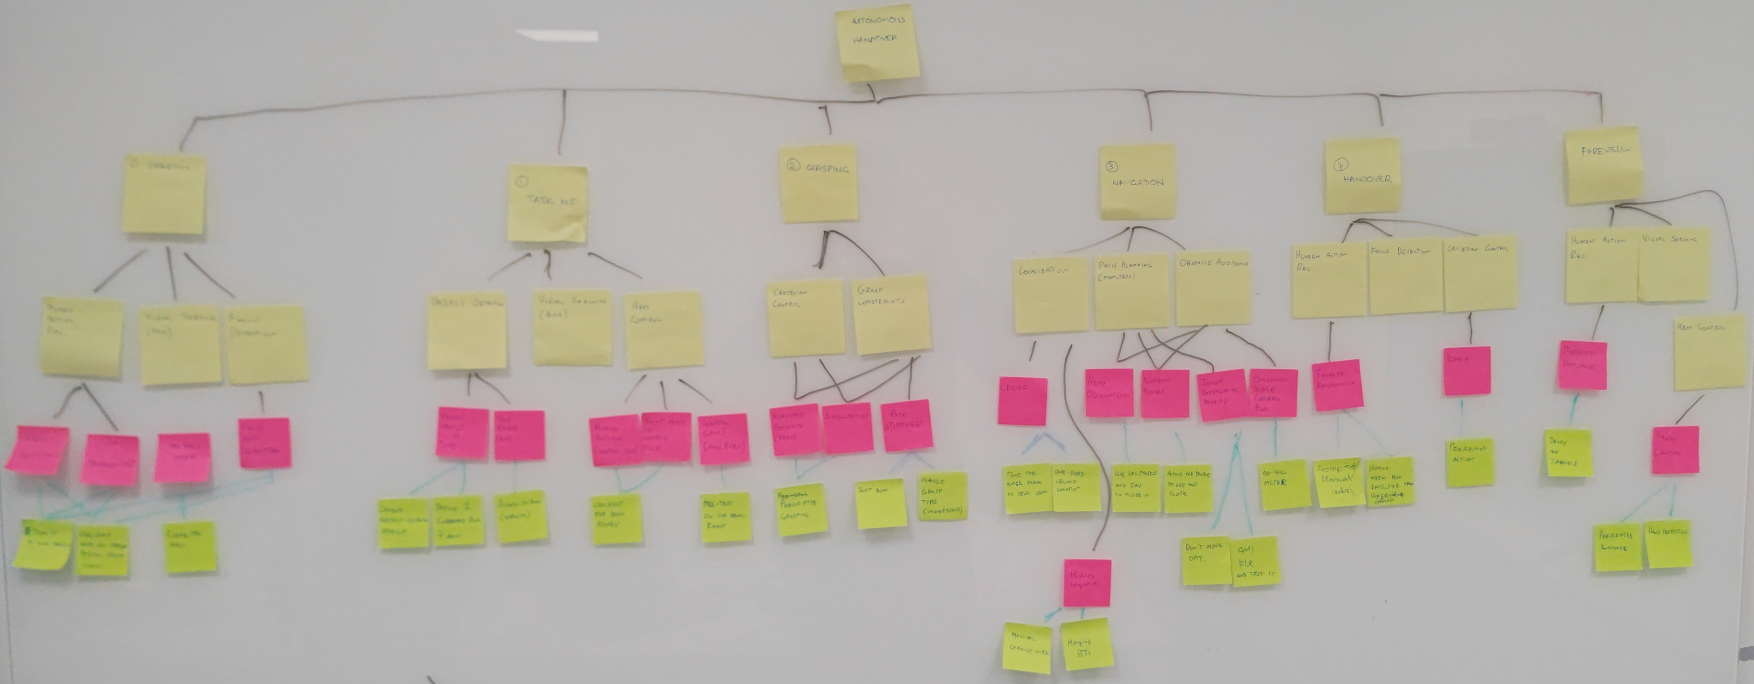
The risk management tree developed for the human-robot interaction demo planning.
I liked this one because it allowed the team to have a group discussion about all the potential problems and fixes. The use of colour was also a nice touch: red for danger, green for safety. Not every risk was considered likely, and so not every countermeasure had to be implemented.
One thing that stood out is that there was 1 countermeasure that could solve numerous problems. For example, estimating the human pose from computer vision is not reliable, and this would make it difficult to interact when handing over objects, or reaching to shake their hand. The solution was to have pre-programmed actions that we could fall back on, and let the humans do the reactive motion planning.
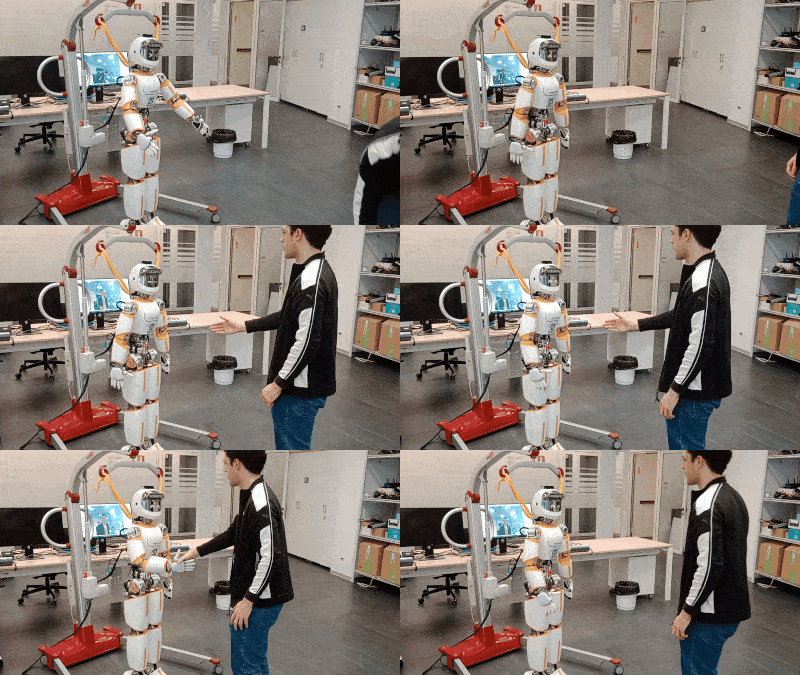
To avoid problems the robot holds out its hand and lets the human grasp it.
Artificial Limb for Skin Contact Sensing
This example was part of a mini-project I worked on for the Terabotics project when I worked in the UK. The (big) project is to use high-frequency electromagnetic waves for detecting cancer cells. To do this you must press the sensor against an organ.
The mini-project was to develop an artificial limb that could be used for experiments in lieu of human test subjects. So it had to have the same optical properties, and the same “squishiness”, as a real human limb.
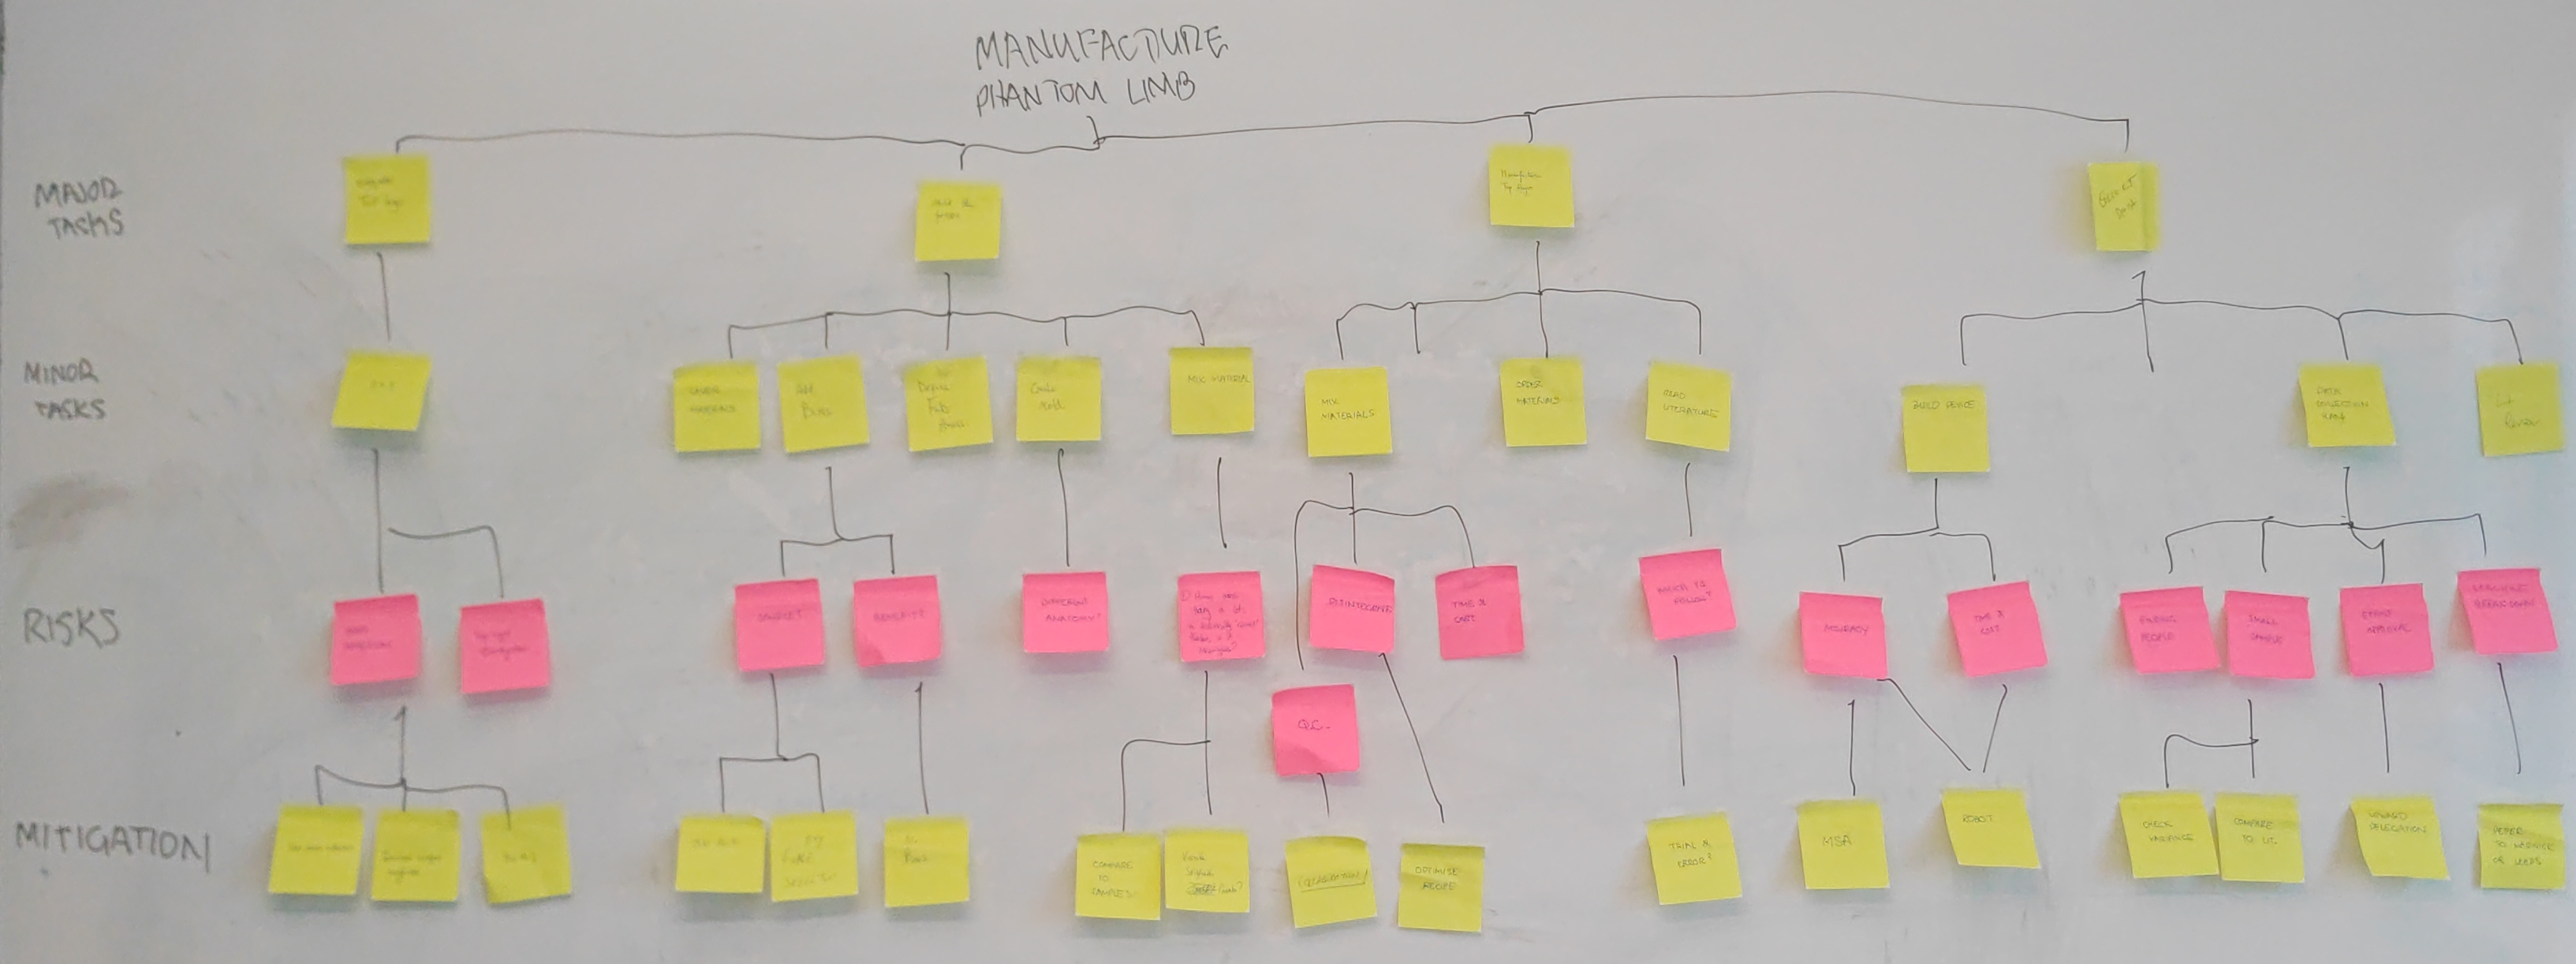
A risk management tree for developing an artificial limb.
Some of the key outcomes from the risk planning:
- The limb had to have the same softness as a human arm, but this varies greatly from person to person. There were 2 countermeasures:
- Read the literature to see what data exist, and
- Collect our own measurements from real human test subjects to certify that our prototype was within the same range.
- The artificial material used for optical sensing decays within a matter of days, so the solution was to develop the artificial muscle layer separately from the skin layer, and attach them only when testing.
Improving Sales at a Butcher Store
This example is from a project I’m working on to improve sales at a local butcher store.
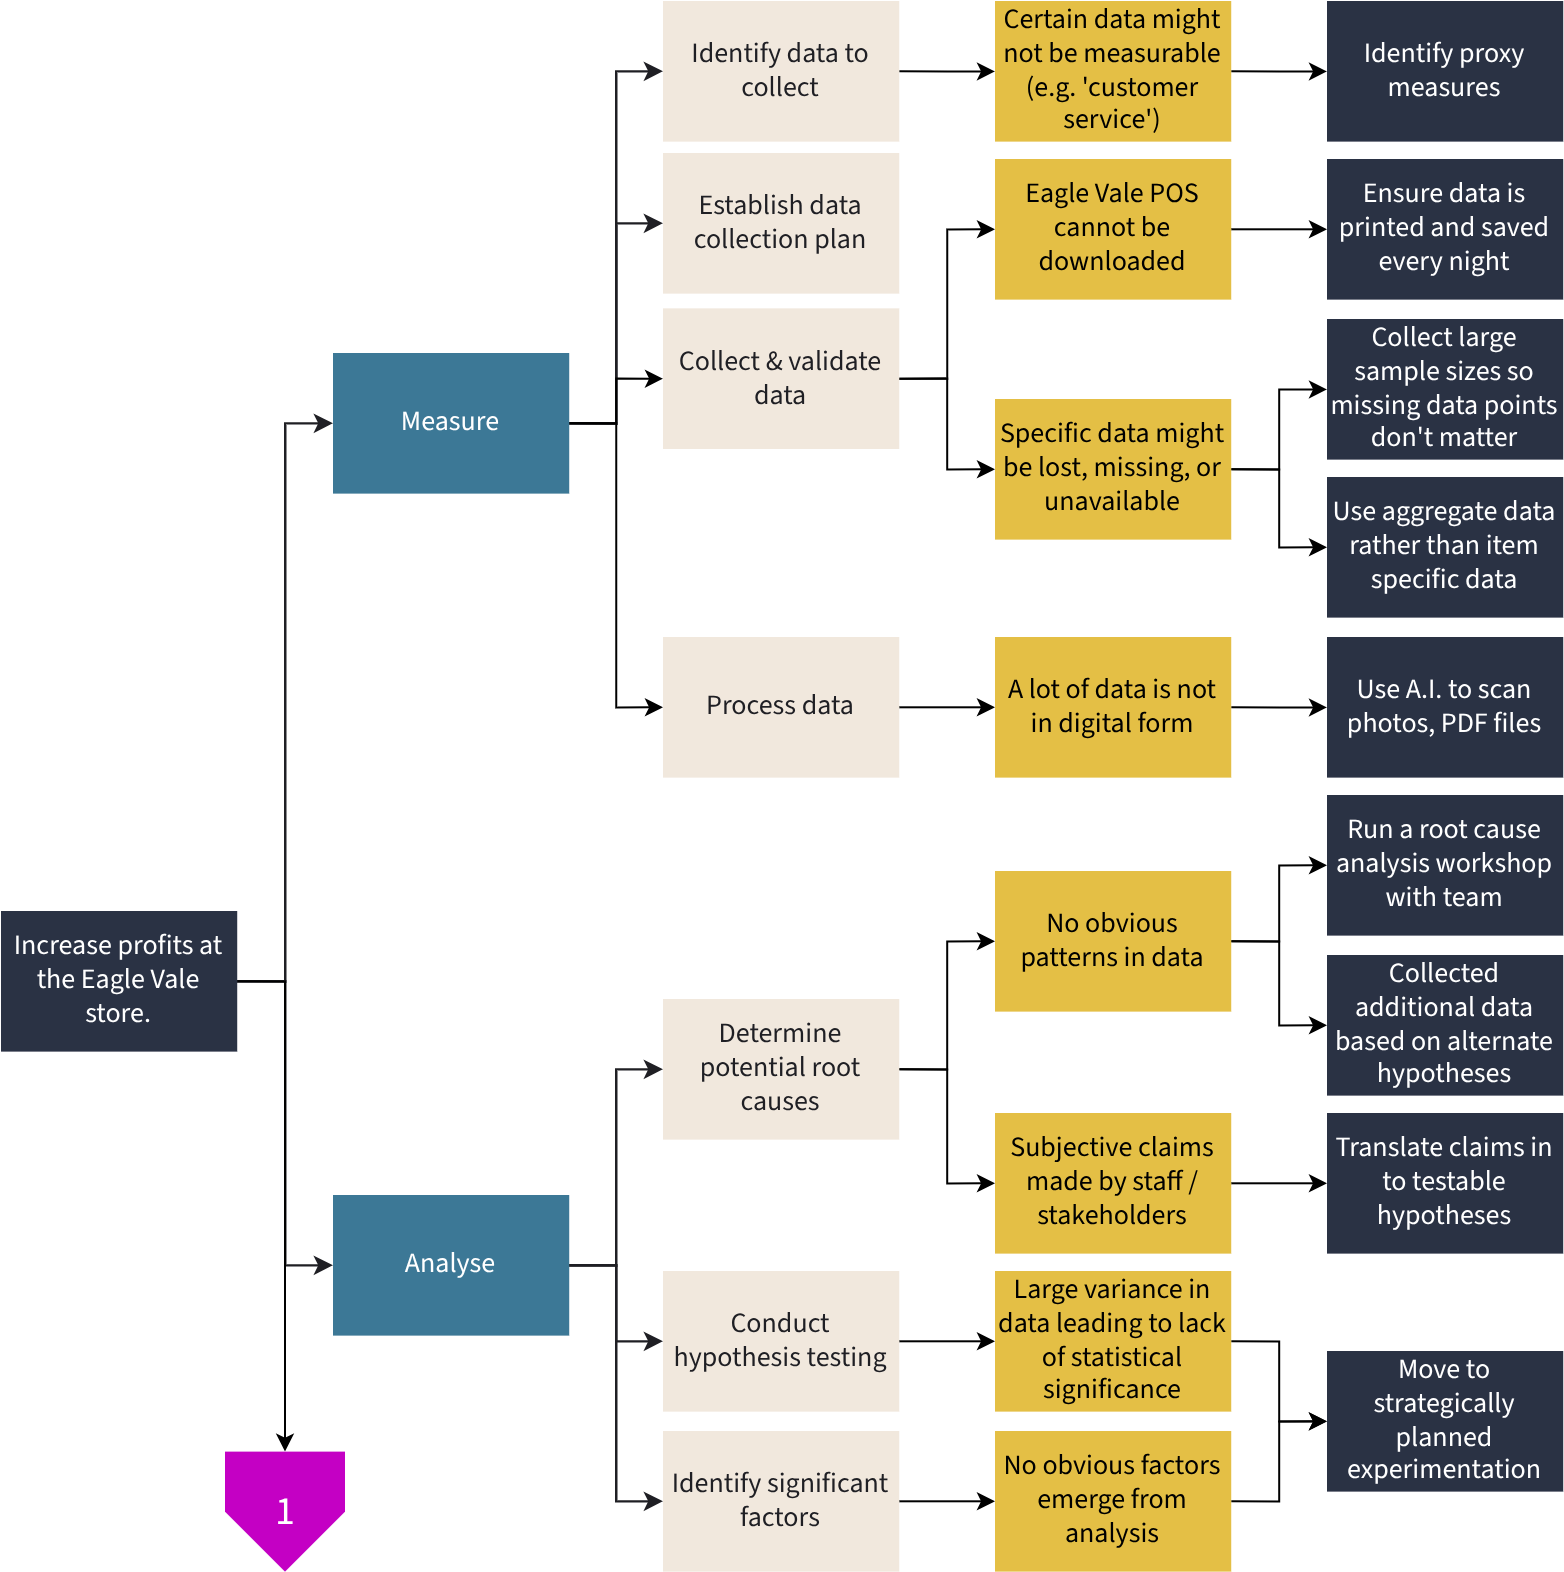
Risk management for the Measure and Analyse phases of a DMAIC project.
Importantly, as part of the task sequencing, I included “decision diamonds” inspired by the original PDPC, coupled with the critical-path calculations of PERT:
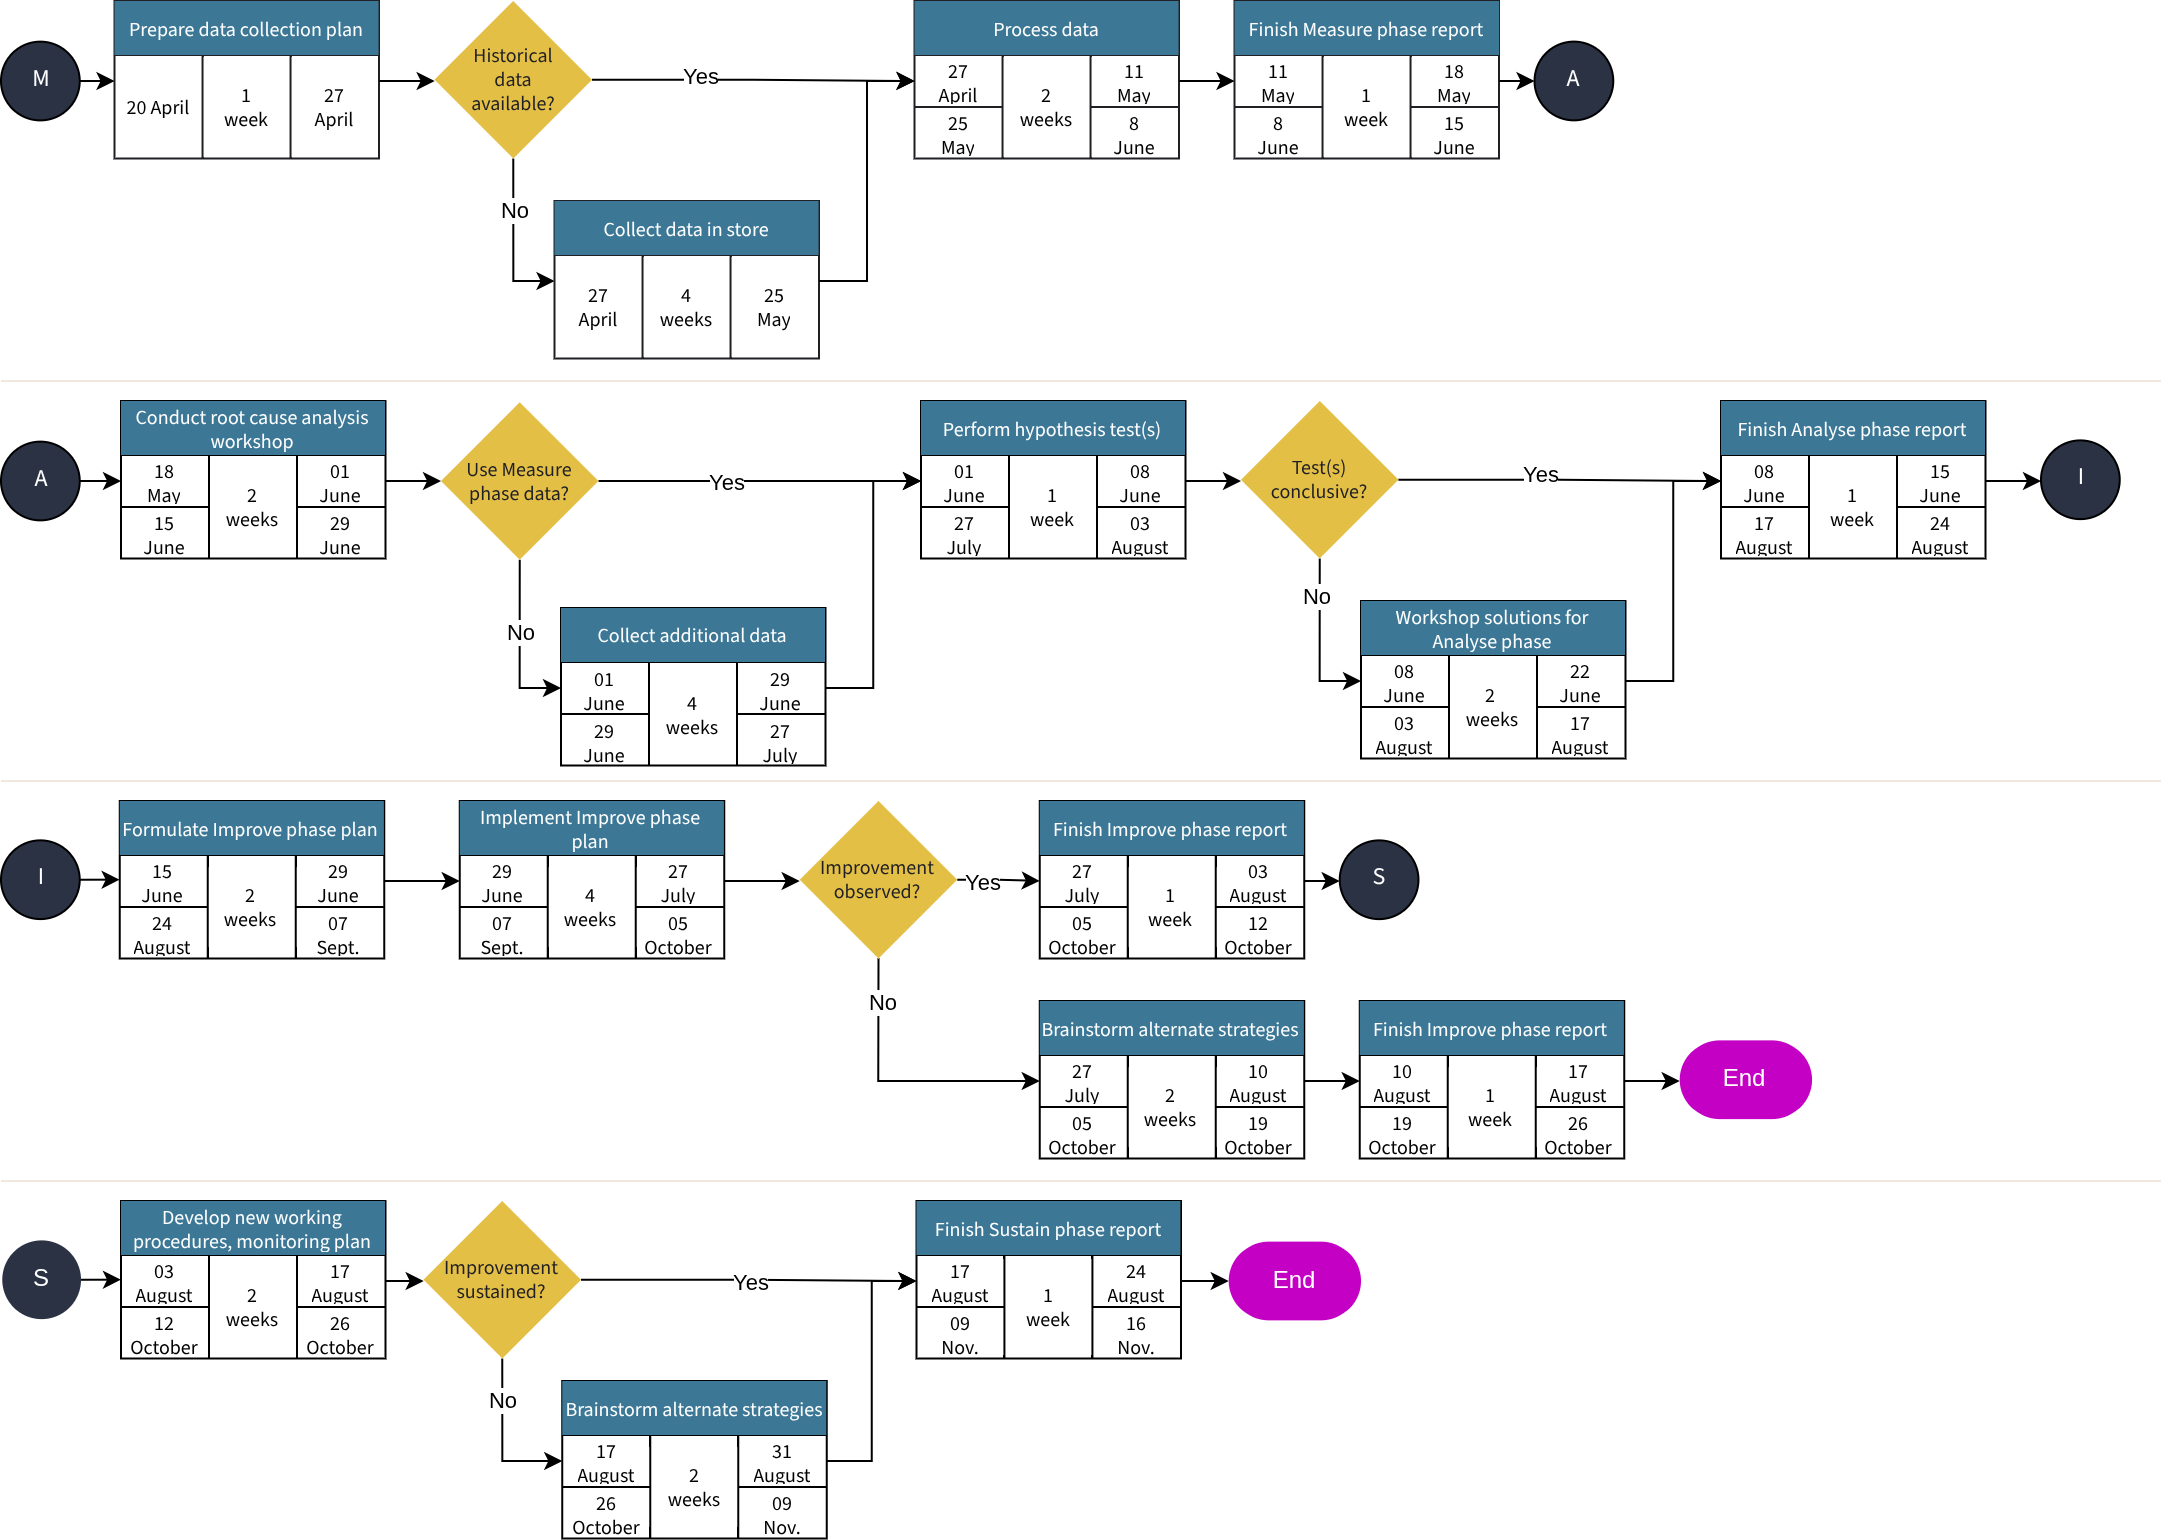
An activity network diagram / PERT chart with decision branches based on the original PDPC.
By identifying major risks, we had contingency paths for how to proceed with the project. Using this, we could also calculate the worst-case scenario for the project timeline. This was useful for anticipating project milestones and the project completion.
Key Takeaways
- Risks are inherent to every project.
- By anticipating and planning for risks we can prevent, circumvent, or mitigate them.
- The “risk management tree” extends the work breakdown structure to identify risks with specific tasks.
- We can:
- Promote a countermeasure to a standard project task to prevent risk, or
- Pivot in our project to execute a planned mitigation strategy.