The Ishikawa (Fishbone) Diagram
The Ishikawa, or Fishbone diagram, is one of the 7 basic tools of quality. It’s a useful conceptual tool for structuring ideation in the service of problem solving. In this post I introduce my method for implementing the tool in root cause analysis, and give 2 applied examples of where I’ve used it to help solve real-world problems.
🧭 Navigation
The Ishikawa, or Fishbone Diagram
What Is It?
This diagram was invented by Kaoru Ishikawa (1915 - 1989) as a conceptual tool to illustrate how (potential) causes are “feeding in” to a specific problem. It is often referred to as a “fishbone” diagram because of its structure. The anatomy of the diagram has several key elements that give it an ichthyian appearance:
- The problem, or “effect” which is written on the right side (the head),
- Long lines branching off representing problem areas (the ribs), and
- Short lines branching off the ribs representing causes (bones).
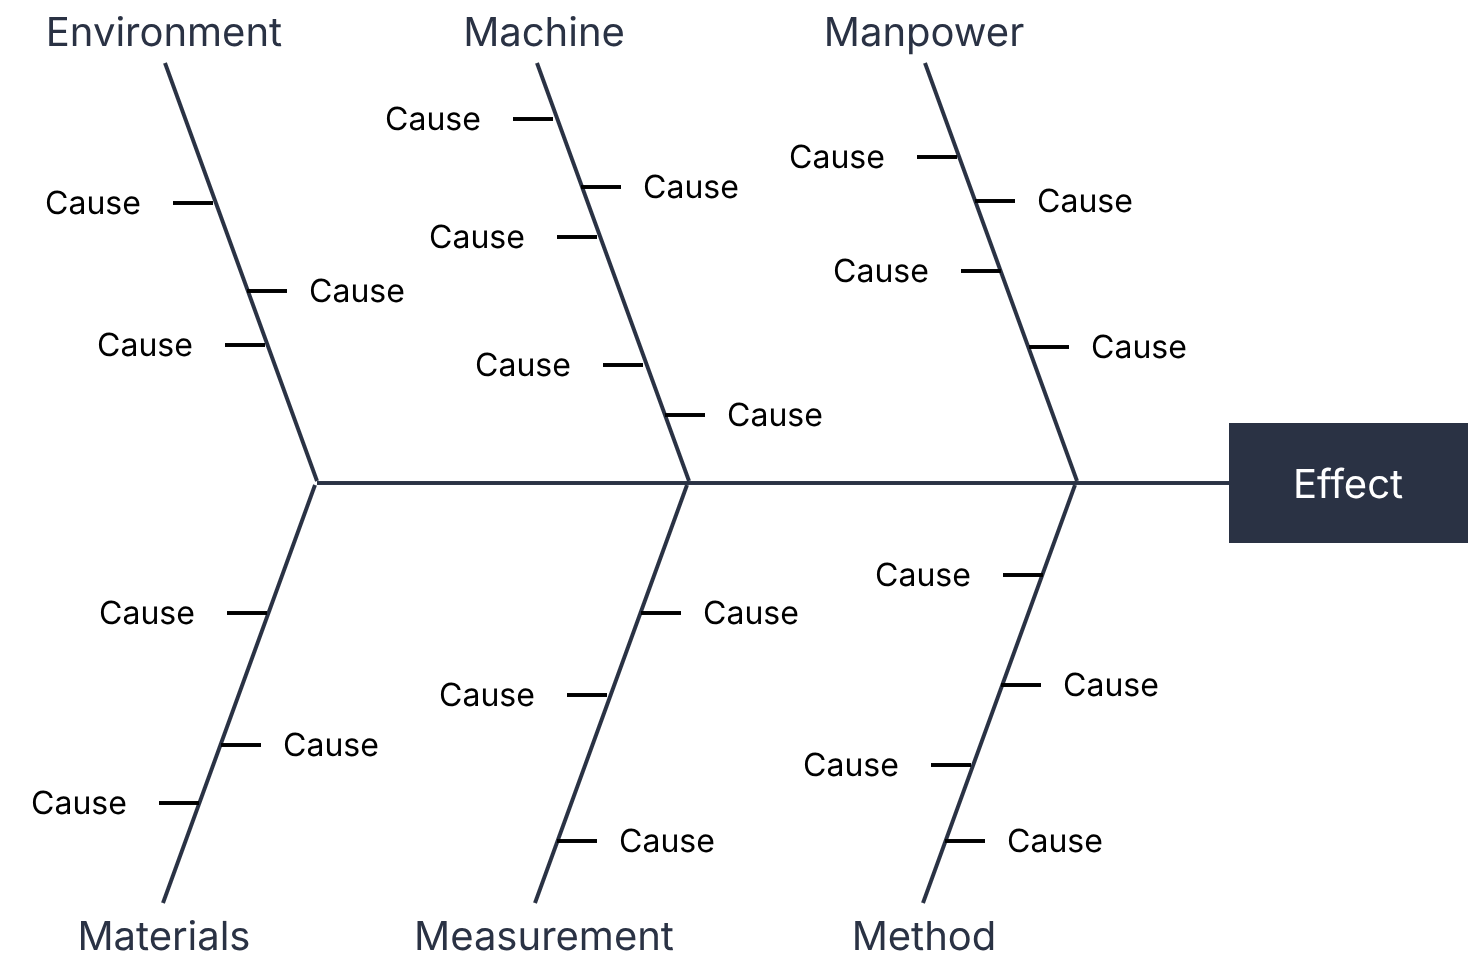
The Ishikawa diagram visualises multiple causes across several categories feeding in to produce an effect, or problem.
Another way to read the diagram is the various causes converging together to produce the effect / problem.
One of the reasons I like this diagram is that it inherently assumes there are multiple causes contributing to a problem - which is very often the case. People are prone to thinking in simple “cause > effect” relationships, but this tool forces practitioners to consider multiple possibilities.
There are 6 canonical categories associated with the Ishikawa diagram that are pertinent to the manufacturing industry:
- Environment: Ambient conditions.
- Machine: Tools, equipment, and automata used in production.
- Manpower: The people conducting the work (or lack thereof).
- Materials: Any substances used in production.
- Measurement: Instruments used to obtain data.
- Method: How work is carried out.
Different industries should utilize alternate categories for better outcomes (I show an example later on).
How Do You Use It?
I’ve found that the most productive use-case for the Ishikawa diagram is to facilitate structured, group brainstorming for problem solving. Often when trying to solve complicated, systemic business problems there is no obvious cause. By getting input from multiple subject matter experts it is possible for everyone’s collective experience to converge on the most likey catalysts.
Here’s my standard procedure:
1) Silent brainstorming 💭
For each category, participants should be given approximately 3 minutes to brainstorm ideas to themselves in silence. This has 2 benefits:
- A strict time limit encourages people to generate as many ideas as possible without deliberation.
- Working in silence prevents people from censoring themselves, or from others dominating the discussion.
2) Read out ideas 🗣️
The workshop facilitator should then collect everyone’s ideas and read them out loud, one-by-one, and add them to the diagram. This provides an opportunity to discuss, clarify, or expand on ideas.
3) Assign votes 🗳️
Once all the ideas have been enumerated, participants should vote on what they believe is the most probable cause. A good heuristic is to give each person a number of votes proportional to the number of ideas:
\[\text{Votes per person} = \frac{\text{Number of ideas}}{3}\]Participants then distribute their votes to as many or few causes as they deem suitable.
4) Plot the priorities 📊
The votes should then be tallied and plotted in a column chart. The top voted problems should then be investigated further to verify them, and reveal further root causes. A good heuristic here is the Pareto principle: pick the top few causes that constitute 80% of the cumulative vote count.
Examples in Practice
Here I present 2 examples where I have successfully applied the Ishikawa diagram to solve business problems with significant financial costs associated with them:
- Optimising routine train inspections, and
- Improving revenue at a butcher store.
Monthly Train Inspections
The Problem
Back in 2013 I worked for Sydney Trains in the Lean Six Sigma group under the Maintenance Directorate. But I also did a 3 month sabbatical as a rail maintainer working on the OSCAR trains. Every 30 days a train would return to the depot for basic inspection and maintenance.
There were 6 teams of maintainers at the depot working on rotating shifts. I noticed that no 2 teams had the same inspection process, and sometimes the same team would not even follow the same inspection process twice!s
The shortest documented inspection time was 4 hours, and the maximum was 20 hours - a difference of 16 hours! This creates 2 major issues:
- An estimated cost gap of about $100,000 / year (assuming we could reduce the average time to 6 hours), and
- It limits the amount of train services you can run.
If we extrapolate point 1 to the 60 day, and 90 day inspections, across every train fleet, at every depot, then this inefficiency could easily inflate to 1,000,000’s of dollars.
The Analysis
During the analysis phase of the project I developed an Ishikawa diagram with fellow rail maintainers. In all we had 17 participants and about 45 ideas.
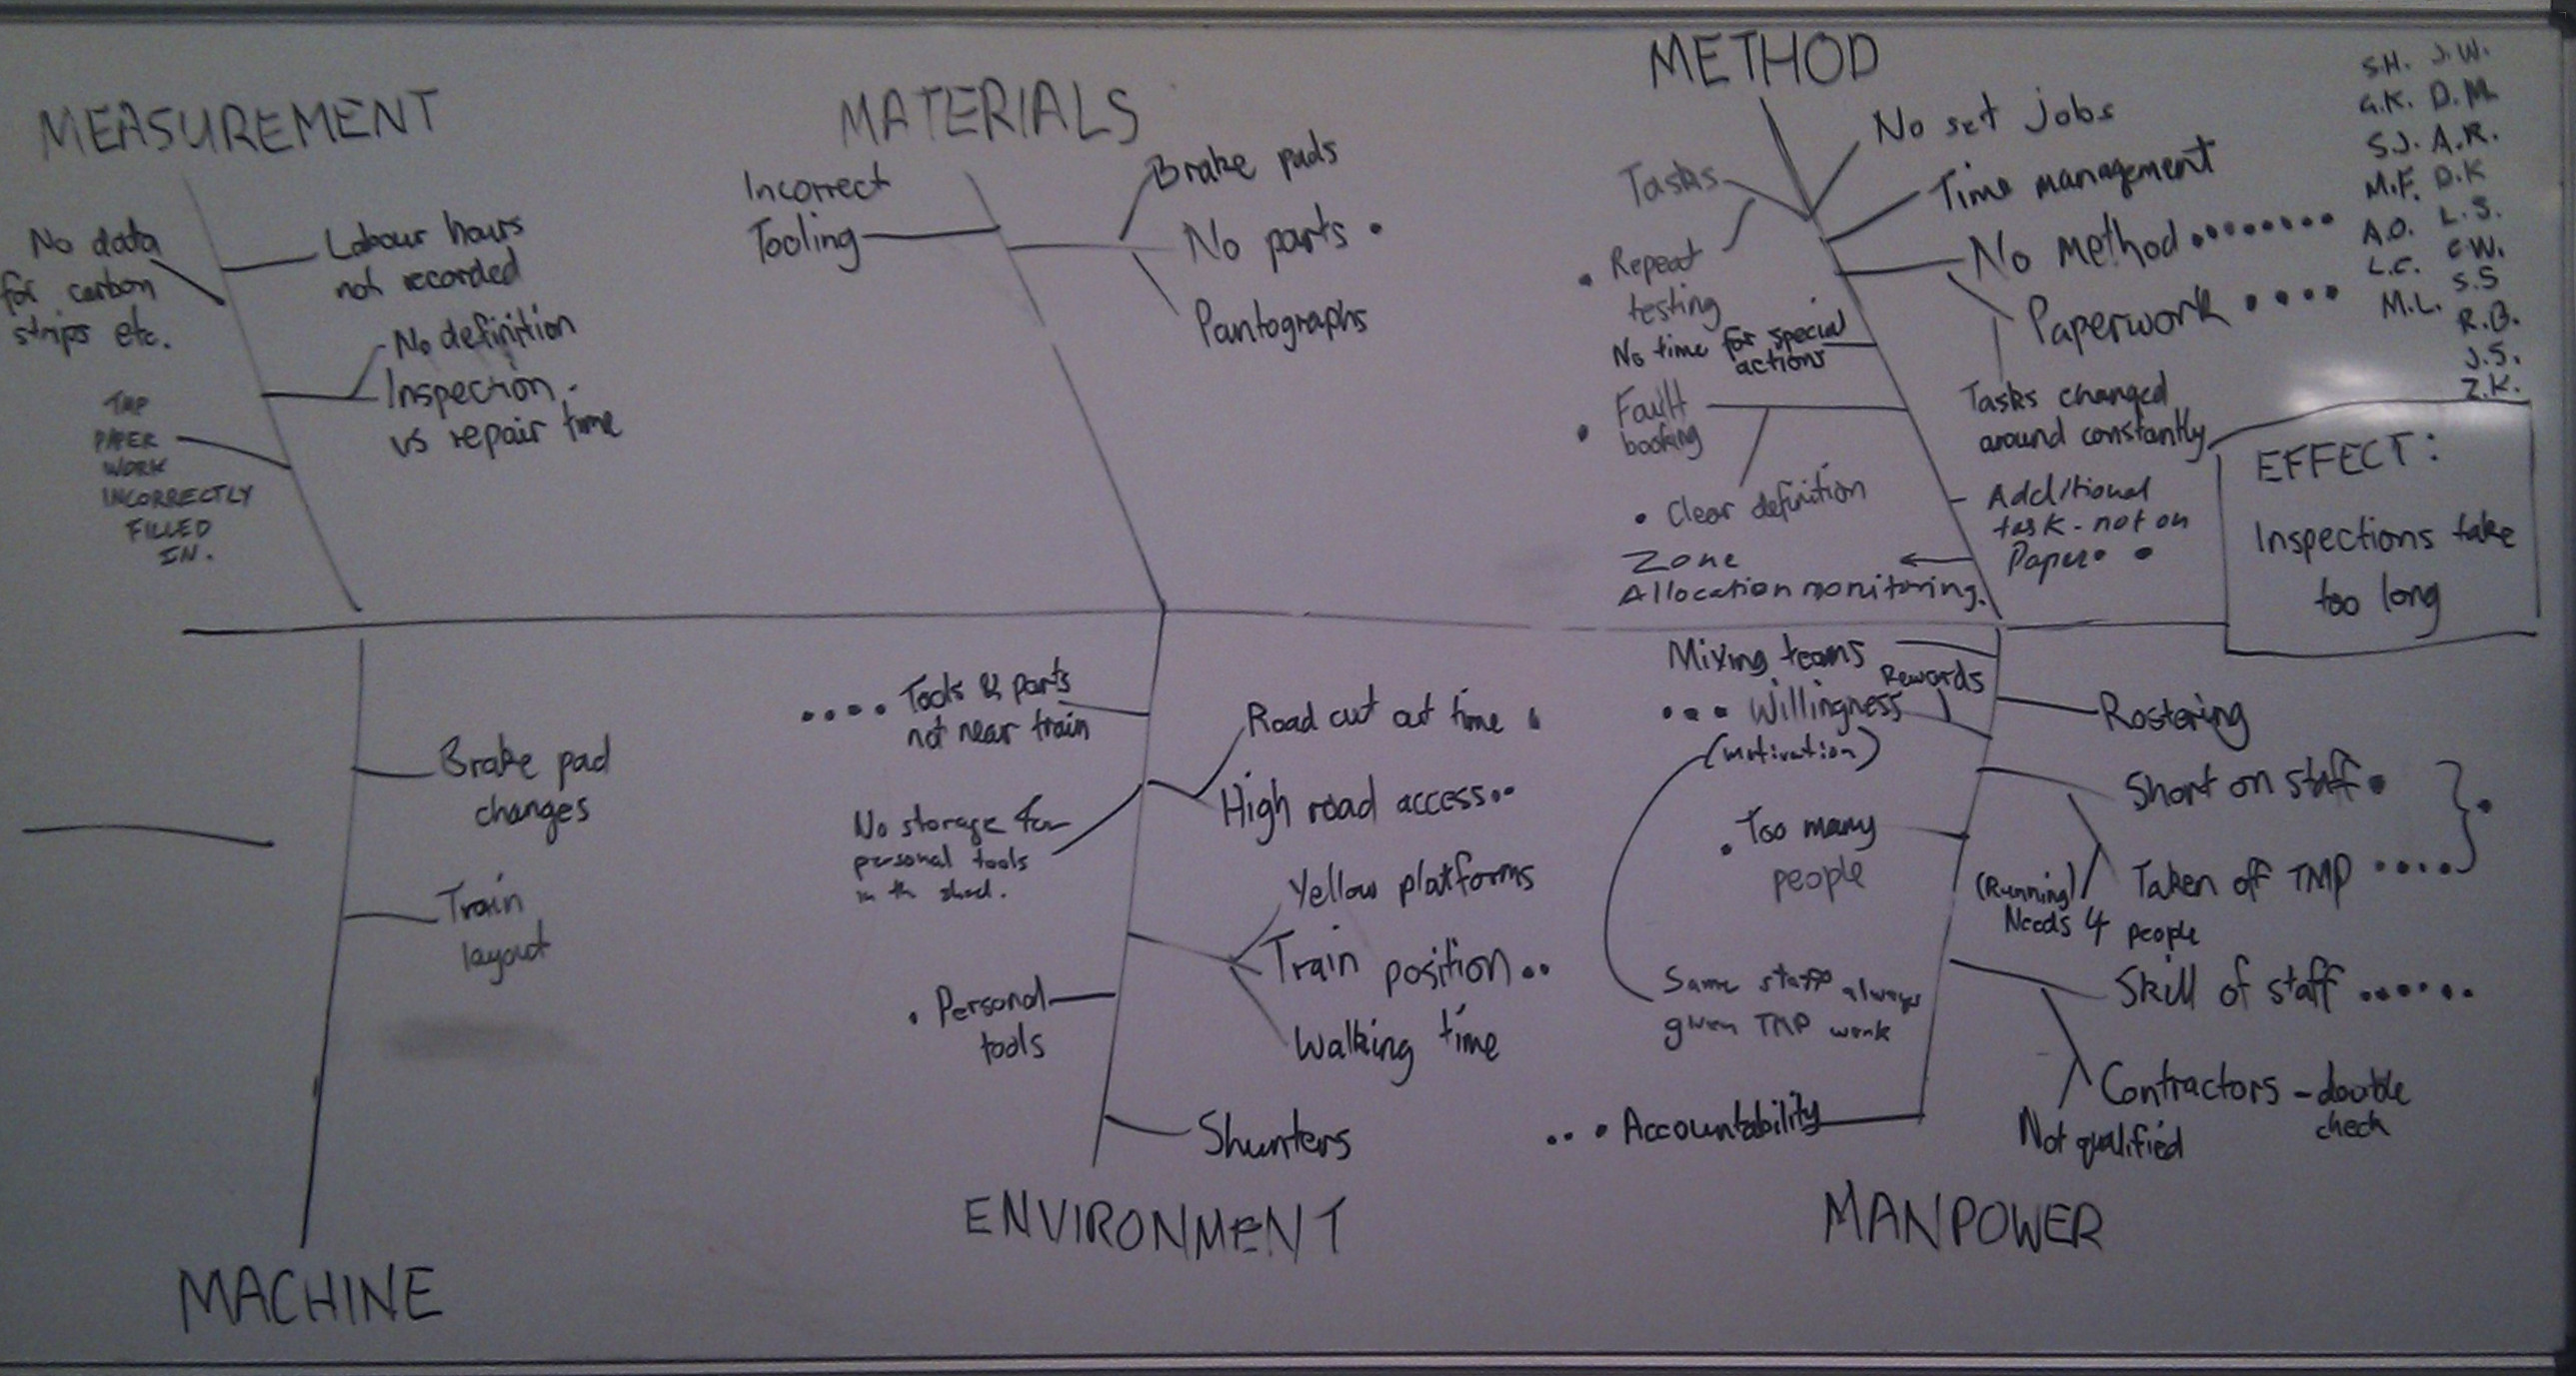
An Ishikawa diagram developed to diagnose why 30 day train inspections times were taking too long.
Based on the votes the leading cause was the lack of method. This was closely related to the layout of the inspection tasks in the paperwork.
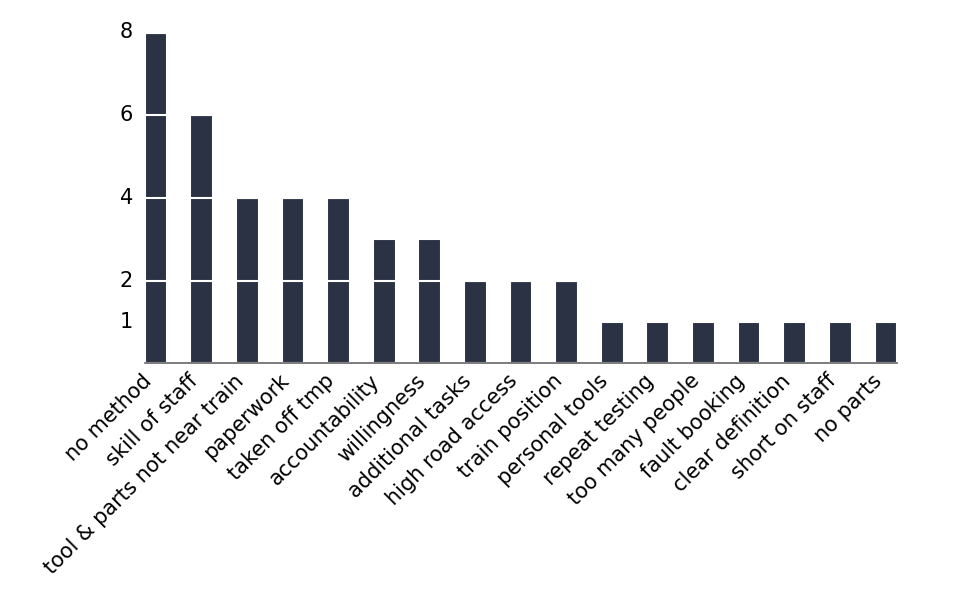
Lack of method was voted the top problem, which was related to the task ordering in the paperwork.
The Solution
The maintainers re-developed the task sequencing by studying a floor-plan of the train layout, and matching this to inspection items as laid out in the technical maintenance documents.
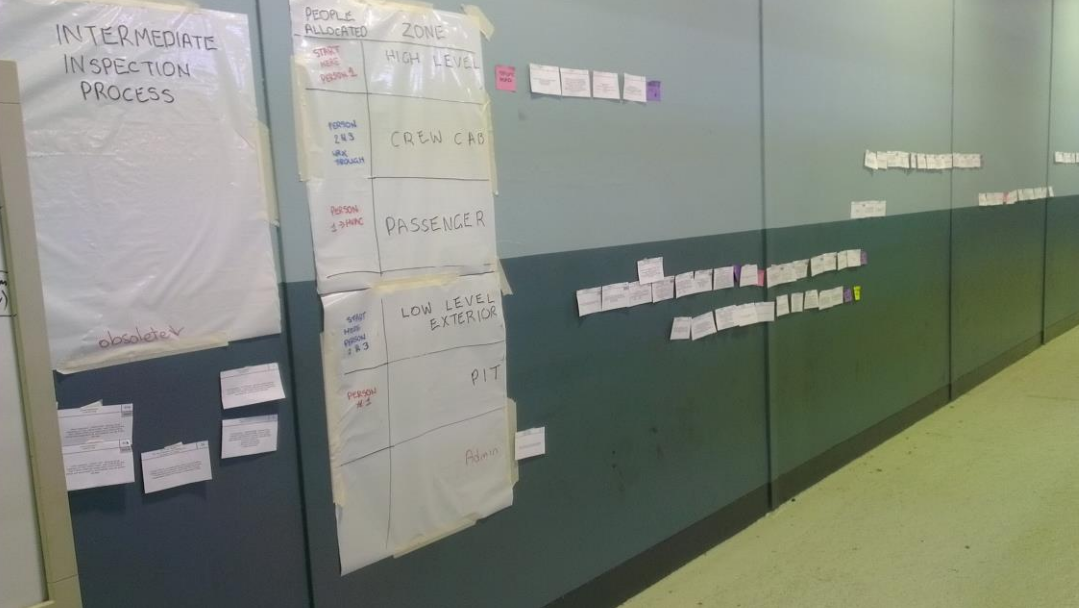
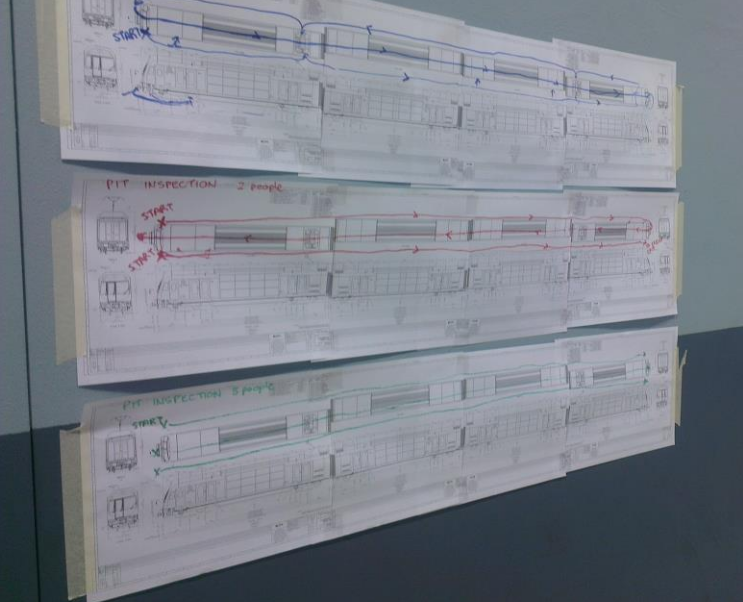
Process mapping was used to optimise the task sequencing and inspection procedure.
Butcher Store Sales
The Problem
My brother-in-law ran 2 butcher stores; one very successful, and one was losing money. I ran an investigation to figure out what the root cause was.
The Analysis
Since this is a butcher store, the 6 categories of the classical Ishikawa diagram were not appropriate. I devised my own categories that I believed would maximise the outcome:
- Competition: Other stores nearby that customers could switch to.
- Marketing: Demographics, promotions, etc.
- Pricing: The cost to consumers, discounts, or lack thereof.
- Product: The meat, condiments, and other accessories being sold.
- Staffing: Training, rostering, and experience.
- Systems: Processes and procedures.
Below you can see the diagram that myself, my brother-in-law, and another staff member developed. It was a fruitful workshop and we generated 43 ideas in total.
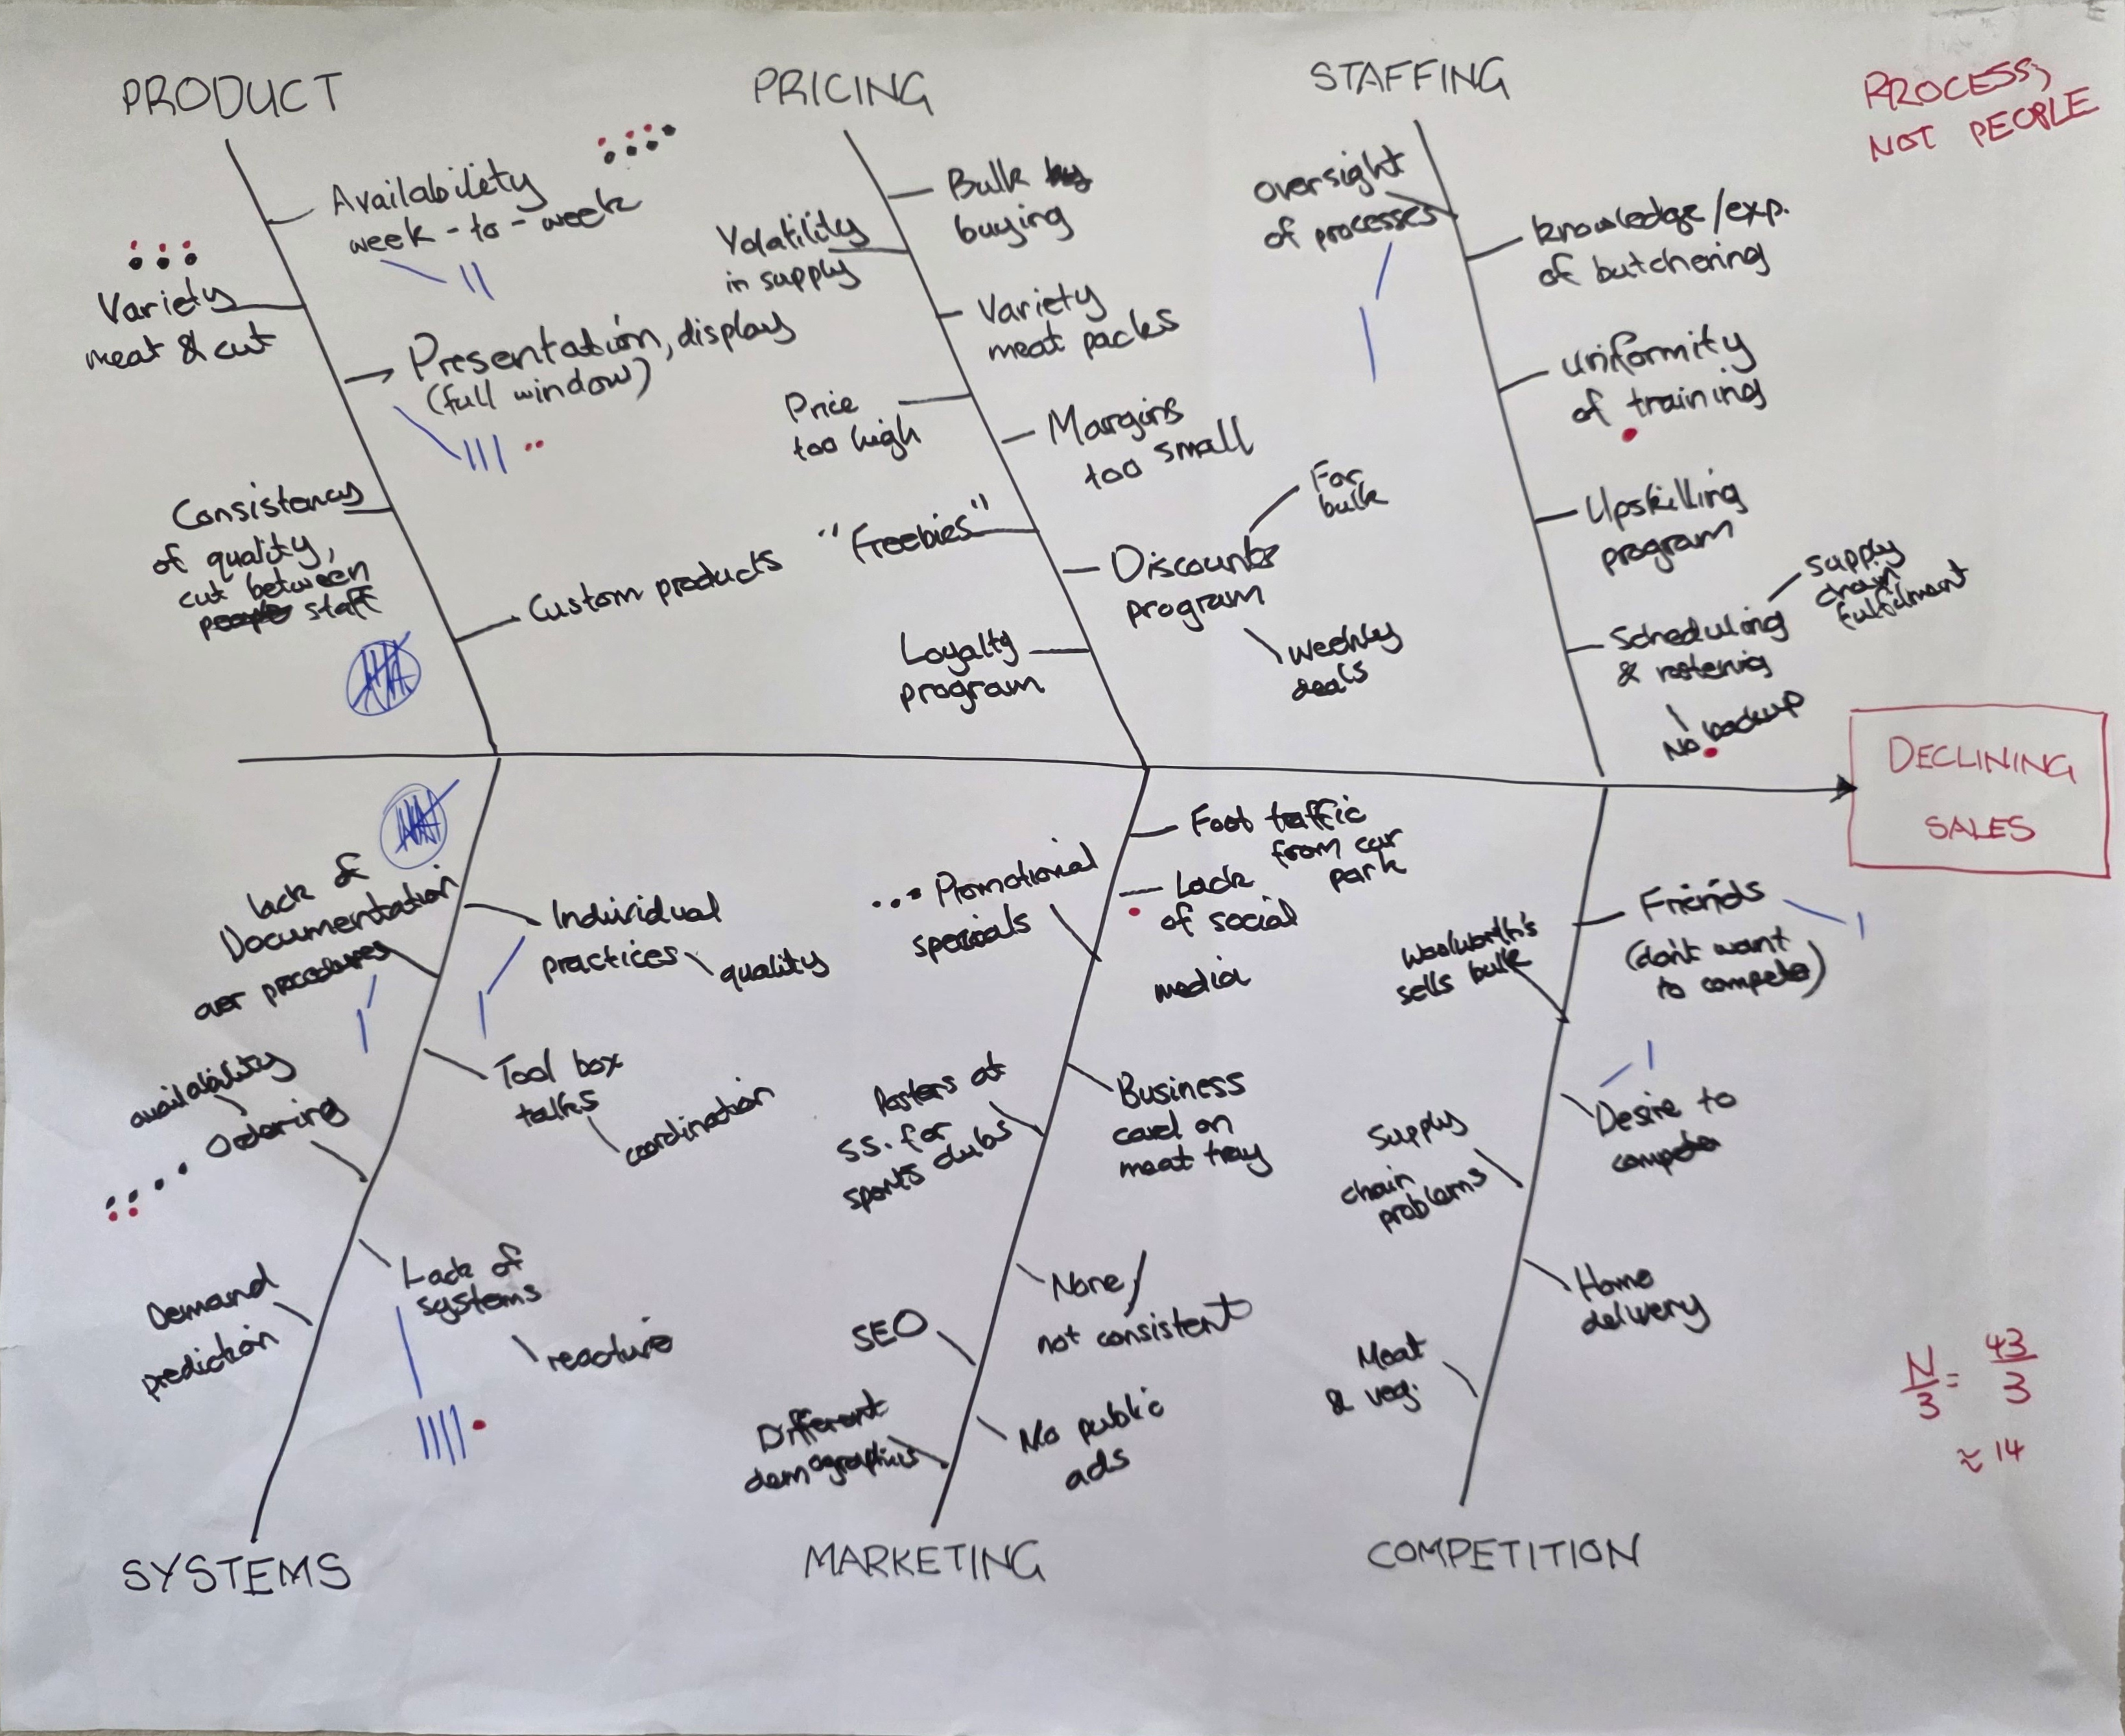
An Ishikawa diagram with 6 custom categories pertinent to running a small business.
As per my process we voted on what we thought were the top issues. I deliberately distinguished my vote (an external perspective) from the staff voters (an internal perspective). Interestingly, we all converged on the same top 2 issues:
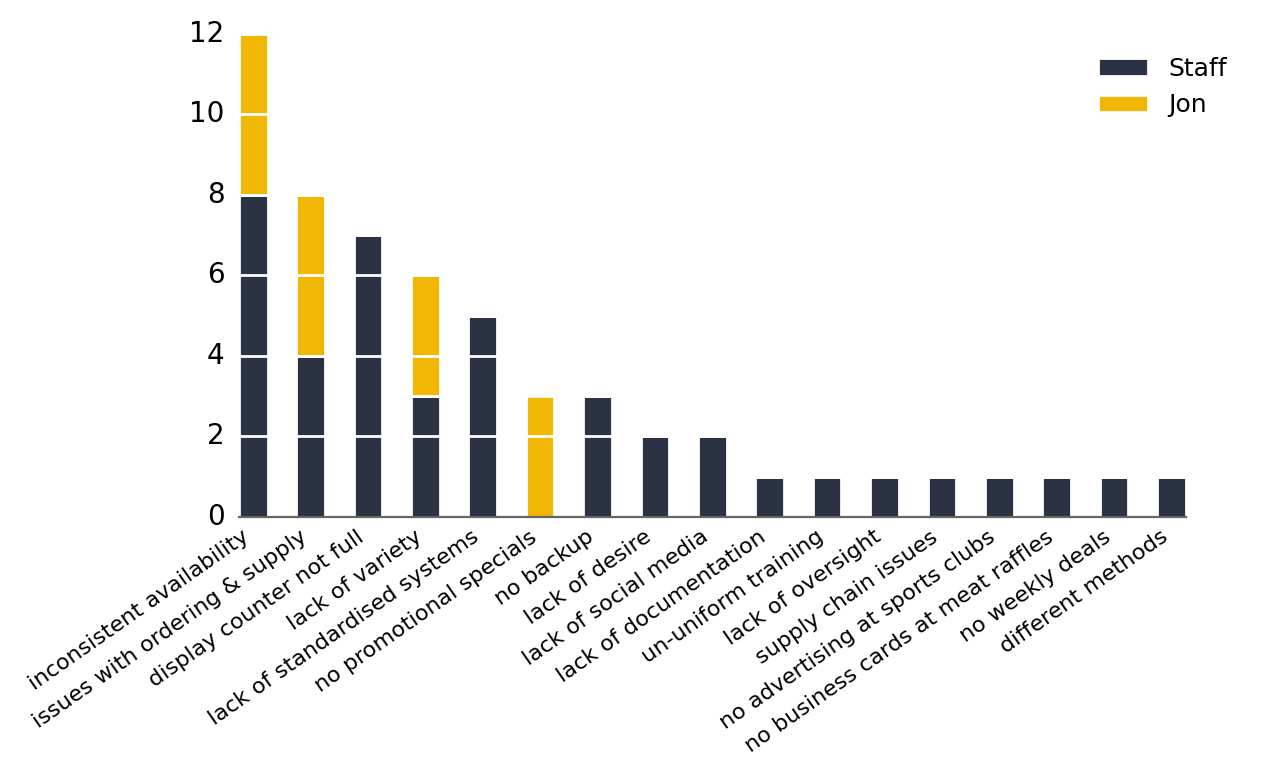
Inconsistent availability was unanimously voted as the top driver behind declining sales.
I then used the 5 Whys technique to drill down on these top 2 issues and identify the deeper root causes. In short, the decline in sales was related to a reduce product lineup, which was done to mitigate the effects of human error. People had been mixing up different types of meat. A smaller product lineup means fewer errors, but also fewer sales.
The Solution
At the time of writing the actual improvement phase is ongoing. But suffice to say the solution will involve visual management. The photo below shows cartons of veal and beef. Can you tell which is which?
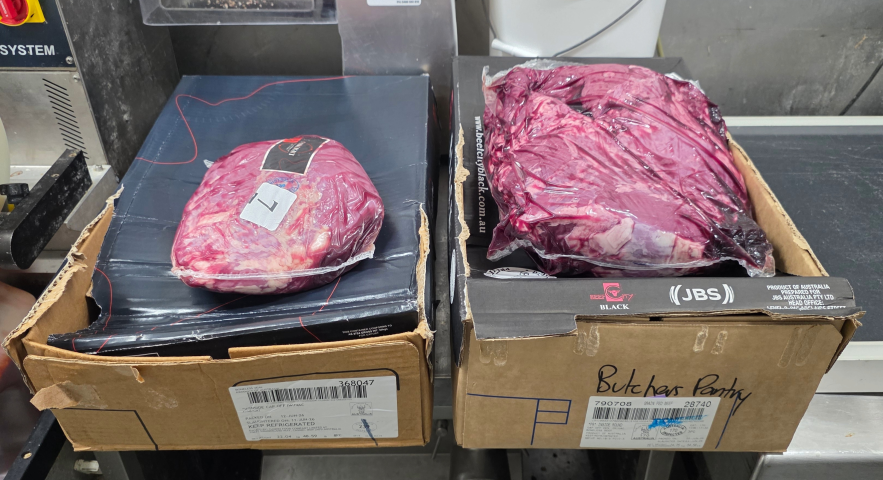
Cartons of meat are almost indistinguishable, except for a tiny label on the box.
The cartons are (almost) identical, and the meat inside is (almost) identical. The only thing that distinguishes them is a small label on the box in tiny font. This mixup is a well-studied type of cognitive error categorised as a slip1. The solution is to redesign the workspace to make the differences more salient2.
Key Takeaways
- The Ishikawa diagram is a powerful, structured problem-solving tool.
- Through group brainstorming we can converge on important issues to act on and solve costly problems.
- The Ishikawa diagram can be supplemented by other tools (e.g. Pareto principle, 5 Whys) to enhance root cause analysis.